To compare the software emulation with the hardware, we carried out an exhaustive series of tests utilizing the actual Maselec MEA-2 EQ hardware and the corresponding plugin. In each test, we meticulously matched the hardware and software settings using robotics to guarantee a precise comparison. Subsequently, we measured the frequency response of both the hardware and the emulated version across every possible setting. Leveraging advanced computational tools, we calculated the error profiles with over 2,900,000 data points to provide a comprehensive and detailed analysis of the performance differences between the two.
A sine sweep was used as the test signal, covering the frequency range of 1Hz to 96kHz. This method allowed for a detailed analysis of the frequency response and error profiles between the Maselec MEA-2 hardware and the emulation plugin.
The Lynx Aurora(n) AD/DA converter operated at a sample rate of 192kHz to ensure high-resolution audio measurements throughout the testing process.
For each test, we carefully adjusted the hardware and software with a robotic/automatic system, ensuring identical settings to match each other, guaranteeing an accurate comparison between the Maselec MEA-2 hardware and the emulation plugin.
We initially measured the transfer function of the signal path (Lynx Aurora(n)) to account for its contribution to the overall measurements. This allowed us to later remove the impact of the Lynx Aurora(n) from the Maselec MEA-2 measurements through a de-convolution process, providing a clearer understanding of the performance differences between the hardware and the emulation plugin.
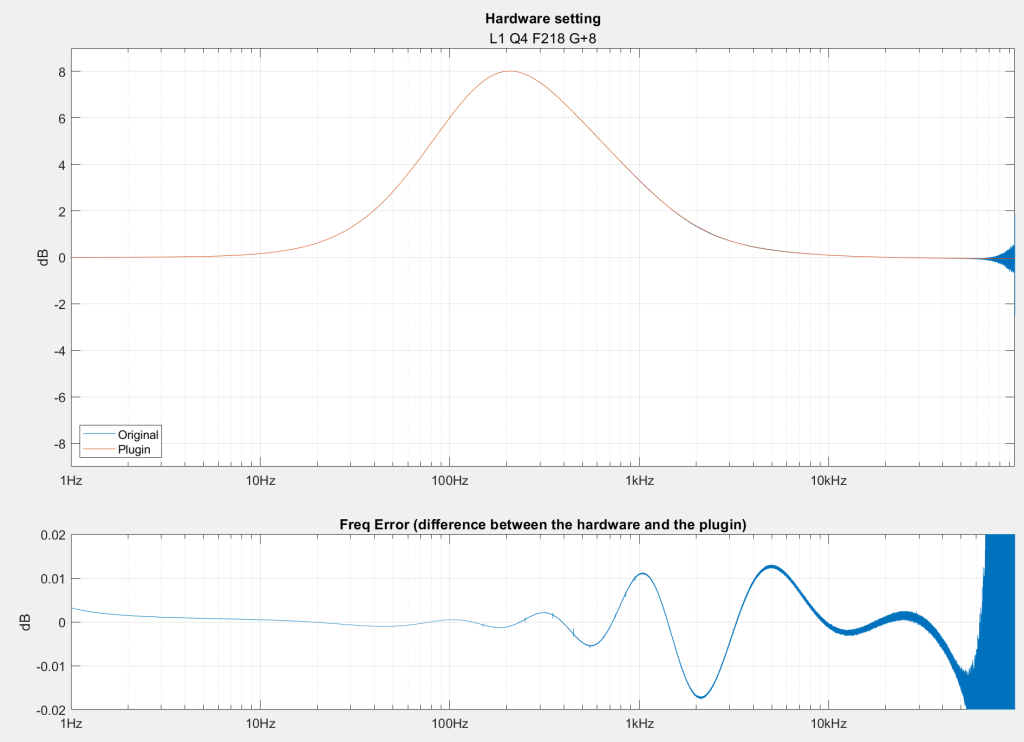
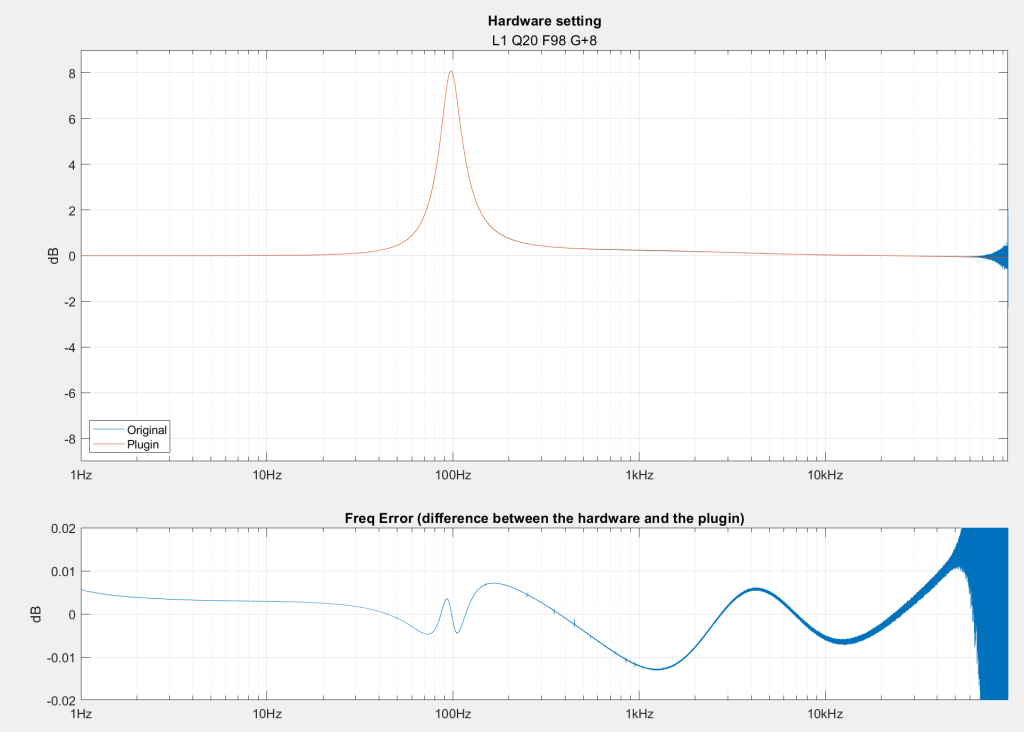
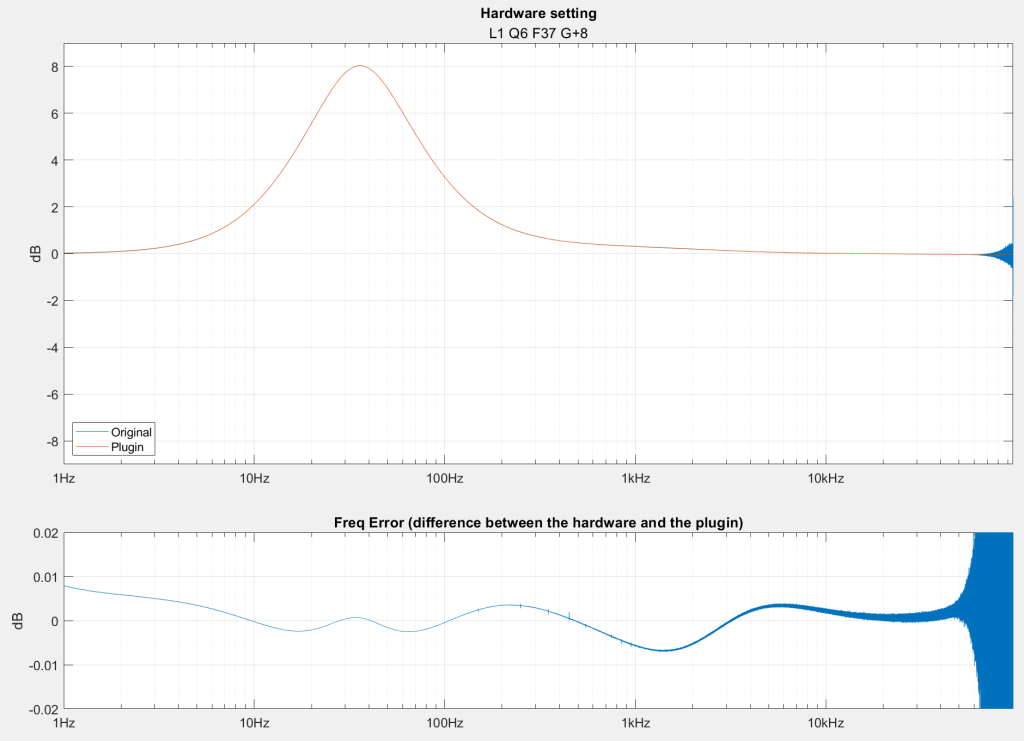
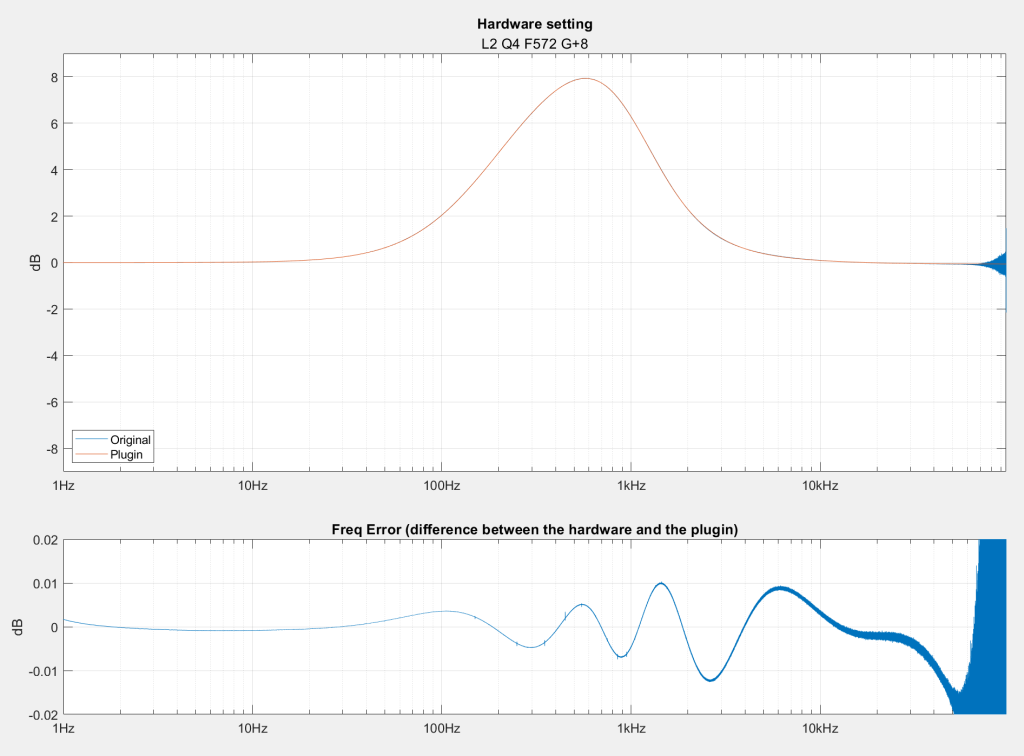
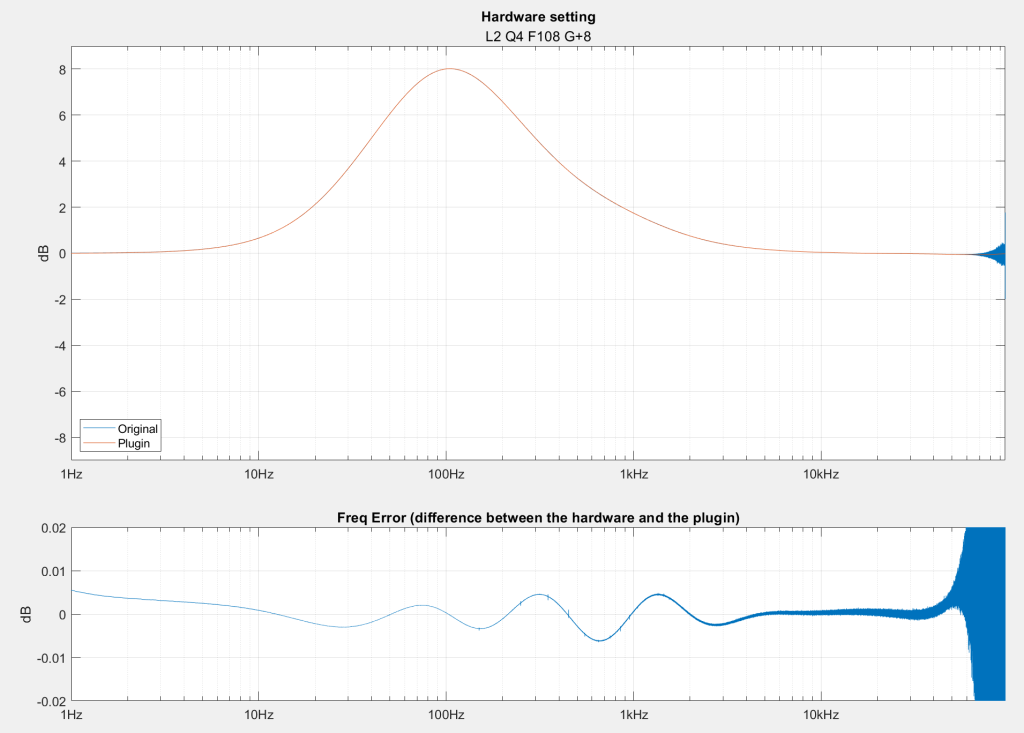
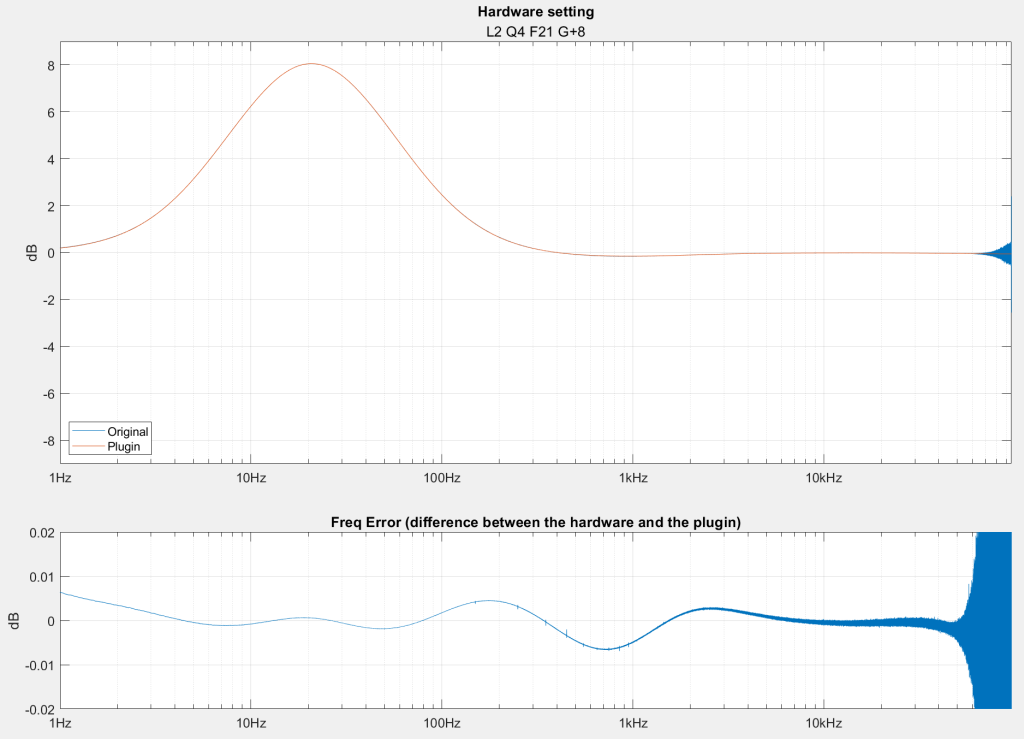
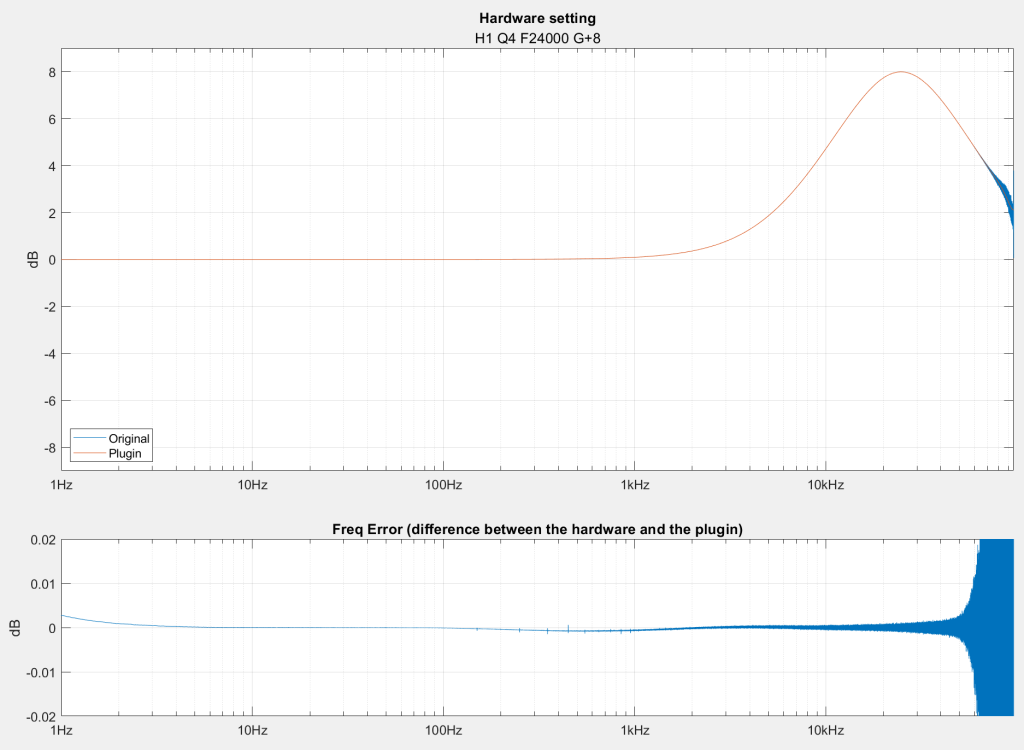
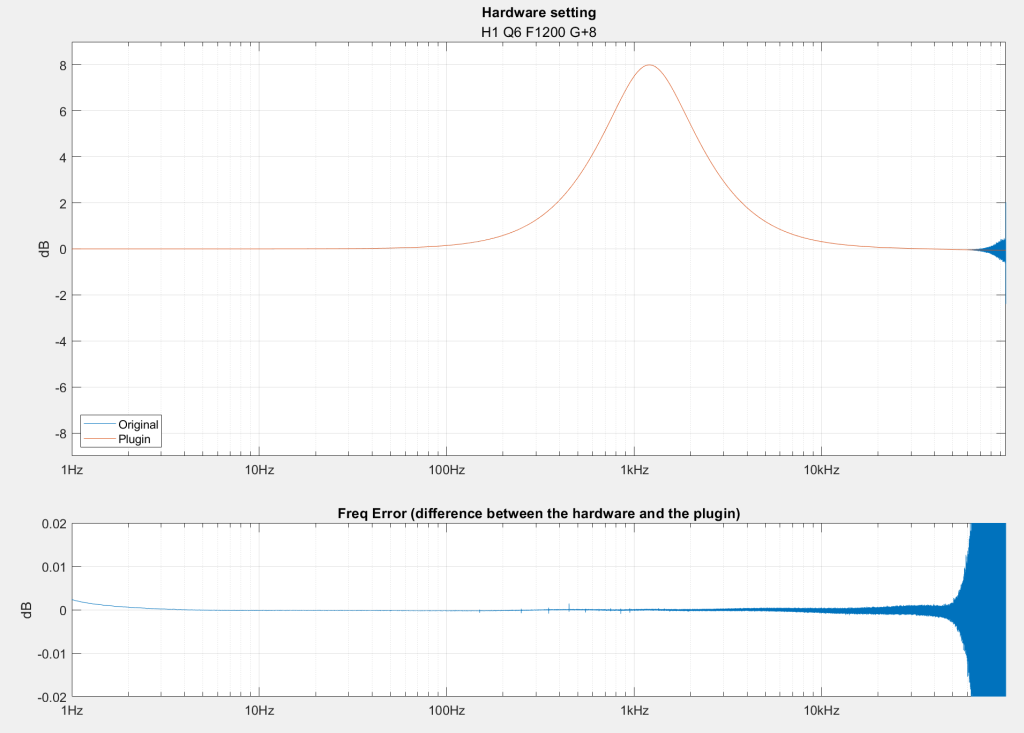
The error profiles for various settings demonstrated a maximum error is less than 0.018dB in the frequency range of 1Hz to 50kHz for all bands.
It is important to note that the error profile does vary slightly depending on the settings. However, the deviation remains within the maximum error of 0.018dB.
The following table presents the error profile results for the emulated Maselec MEA-2 EQ and the actual hardware across the different bands.
| Band | Frequency range | Maximum error |
|---|---|---|
| Low band 1 | 1Hz - 50kHz | 0.018dB |
| Low band 2 | 1Hz - 50kHz | 0.015dB |
| High band 1 | 1Hz - 50kHz | 0.003dB |
| High band 2 | 1Hz - 50kHz | 0.005dB |
Graphs showcasing the error profiles between the Maselec MEA-2 hardware and the software emulation are provided to visually represent the performance differences. The graphs illustrate the discrepancies in frequency response across a range of 1Hz to 96kHz and are organized with the settings exhibiting the largest errors at the top. The error profile remains relatively similar for both positive and negative gain settings.
It is crucial to emphasize that the error profiles for all other settings tested exhibited a lower error than the ones depicted at the top of the graphs below. These graphs represent the settings with the largest errors, and the majority of other settings yield even more accurate performance between the Maselec MEA-2 hardware and the emulation plugin.
Additionally, the error graph has a zoom factor of 450x compared to the frequency response graph, providing a highly detailed view of the error profiles.
The random noise observed at the very high frequencies in the graphs is attributed to the artifacts from the de-convolution process and noise shaping and quantization noise that occurs during the AD/DA conversion process in the Lynx Aurora(n). It is essential to note that this noise shaping is not an exclusive phenomenon of the Lynx Aurora(n) unit, but rather a common occurrence in AD/DA converters.